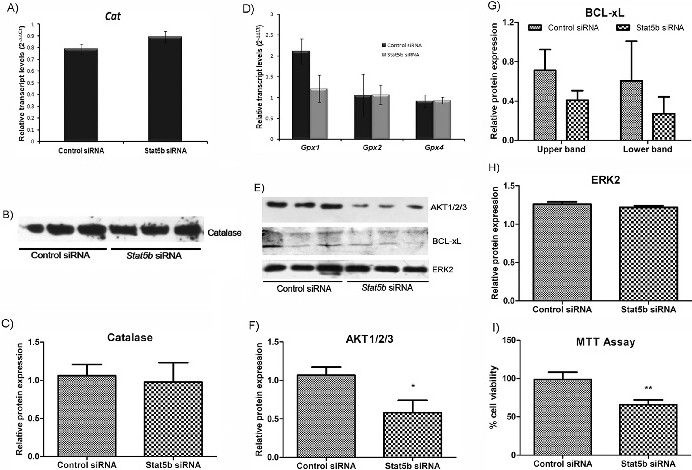
Fig. 5. Status of H2O2 metabolizing enzymes and AKT upon Stat5b silencing. A) qRT-PCR graphs showing the relative expression of H2O2 metabolizing enzyme Cat in control and Stat5b siRNA treated MIN6 cells with 18SrRNA as endogenous control. The transcript levels do not show significant difference between control and treated samples (n = 3). B) Western blot and C) densitometric analysis of catalase (n = 3) corroborate the Cat qRT-PCR results. D) qRT-PCR graphs showing the relative expression of H2O2 metabolizing enzymes Gpx1, Gpx2 and Gpx4 in control and Stat5b siRNA treated MIN6 cells with 18SrRNA as endogenous control (n = 3). Except for Gpx1, the transcript levels do not show significant difference between control and treated samples. E) Western blot of prosurvival molecules AKT1/2/3, BCL-xL and ERK2. AKT1/2/3 and BCL-xL shows decreased levels in Stat5b siRNA treated samples compared to control siRNA treated samples, also represented by densitometric analysis of the bands (F and G), while ERK2 (H) did not show significant difference (n = 3). The bands were normalized using actin in Fig. 1E. I) Representation of percentage viability of control and Stat5b siRNA treated cells, as identified by MTT assay. Stat5b siRNA treated cells show decreased cell viability compared to the control siRNA treated cells (n = 3).